Model review

Dell Precision 7510 review

Dell Precision 7510 — from 2015, 2.8 kg, performance 39.
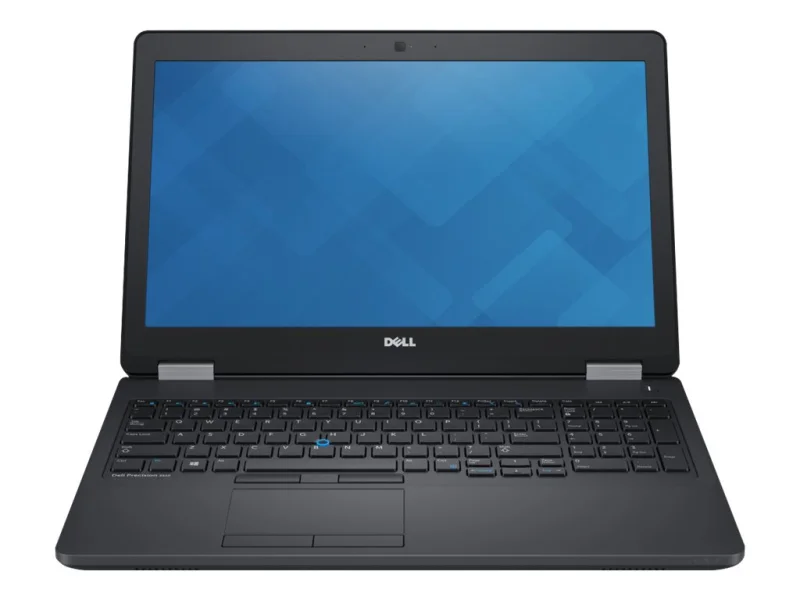
Dell Precision 7510

Technical specifications

Type Workstation
Release year 2015
Screen 15.6" · 1920x1080
Processor Intel Xeon E3-1535MV5 , Intel Core i7 6820HQ , Intel Core i5 6300HQ
Graphics Quadro M2000M , Quadro M1000M , AMD FirePro W5170M , Quadro M1000M 2GB
Max. RAM 32 GB
Weight 2.8 kg

Performance scores

Performance
39
/100
CPU
48
/100
GPU
20
/100
USComp
45
/100

A 2015 Xeon workstation at ultra-budget money

The Dell Precision 7510 (2015) carries a Xeon E3-1535MV5, a Quadro M2000M, and 32GB of RAM at $251 — the ultra-budget band of the workstation class. Every measured axis reads era-floor: mobility 12 against 36, graphics 19.89 against 42.23 (53 percent below), reliability 21 against 43.5. What the data still certifies is the professional platform — ECC-class memory, ISV graphics of the Maxwell generation — at a quarter of launch money.

Minimum bars only, honestly

Overwatch, Grand Theft Auto V (measured 140 fps at the min level), and Rainbow Six Siege clear their minimum bars, and Visual Studio Code clears its minimum. No recommended bar is met — the M2000M's era has closed for anything beyond light duty. The honest scope: entry viewport work, older-engine play at minimum settings, and a stationary platform whose value is the Xeon badge and the price.

Price and value trajectory

From a $2,200 launch price the 7510 has shed 8.31 percent per year to $251, with a projected $211 (a further 15.9 percent) in two years. A decade of depreciation has flattened the curve completely — the machine is priced at its terminal value, and the remaining slide is measured in tens of dollars.

Against its price neighbors

Above it sit the ZBook 15 G3 at $265 and the ZBook 15 G4 at $269 — HP's same-era rivals with marginally newer GPUs; below it the ZBook 15u G4 at $221 and the Precision M4800 at $221 — lighter-duty and older-generation takes. The band is a museum row of 2015-2017 workstations; the 7510 holds the Xeon differentiator and the middle price. Nothing here clears beyond minimum bars.

Bottom line

The Precision 7510 at $251 is a buy-the-floor workstation: minimum-bar flags, a certified platform of its era, and terminal pricing. The mobility score of 12 and reliability of 21 state the deal's terms plainly. For light professional duty or a cheap stationary workhorse, it's honest money; for anything more, every measurement says to look up the shelf.

🧭 Your context

Stage: Refining requirements

You're refining — compare finalists head-to-head.

🎯 For your profile

You've viewed: You've recently viewed 8 models — compare this model with them in the analogs matrix.

⭐ What stands out

mobility
12
graphics performance
19.9
reliability
21
above median below median class median
  • mobility is lower than typical workstation class (+66.7%) (low tier).
    budget segment of category
  • graphics performance is lower than typical workstation class (+52.9%) (office tier).
    below class average
  • reliability is lower than typical workstation class (+51.7%) (low tier).
    budget segment of category

🔁 Alternatives

Compromise axis: mobility ↔ compute power

↑ Pricier and more powerful
HP ZBook 15 G3 · $265
HP ZBook 15 G4 · $269
↓ Cheaper and less powerful
HP ZBook 15u G4 · $221

🎮 What it can run

⚙️ Configuration analysis

Top configuration: Intel Xeon E3-1535MV5 · Quadro M2000M · 32GB RAM
CPU: Intel Xeon E3-1535MV5 GPU: Quadro M2000M RAM: 32 GB
office tier

Top configuration is built for office apps, web browsing, and basic daily tasks.

🤔 How to choose

Universal advice for any use case.

  • Reliability vs price: reliability (median 43.5) ↔ price (median 471).
  • Weight vs CPU: mobility (median 36) ↔ overall performance (median 60.6).
  • Upgradeability vs battery: upgradability (median 100) ↔ battery life (median 2.4).

Precision 7510: verdict

+
Best for: a balanced profile
!
Watch out for: mobility and portability
$
Price: $251 — a budget-friendly pick

➡️ Next step

You're refining — compare finalists head-to-head.

Technical reference for Dell Precision 7510.

Full specifications

Brand
Dell
Series
Precision 7xxx (high class)
Type
Workstation
Release year
2015
Screen size
15.6"
Resolution
1920x1080
Panel type
ips
Color gamut (sRGB)
100%~
RAM (max)
32 GB DDR4
Weight
2.80 kg
Ports
6
Backlit keyboard
Webcam
TPM (security)
Battery
68 Wh~

Performance scores

Performance
39
/100
CPU
48
/100
GPU
20
/100
USComp
30
/100

Performance metrics

Performance 39
Portability 20
Light office 60
Gaming 31
Creative 35
Energy efficiency 53
Connectivity 85
Value 59
Color accuracy

🎮 Gaming performance

FPS @ 1080p for the model's best GPU

Game FPS (1080p) Verdict
CS:GO 240 ✓ Комфортно
Overwatch 240 ✓ Комфортно
GTA V 140 ✓ Комфортно
PUBG: Battlegrounds 140 ✓ Комфортно
Valorant 80 ✓ Комфортно
Dirt Rally 69 ✓ Комфортно
Dota 2 60 ✓ Комфортно
Rainbow Six Siege 52 ⚠ Играбельно
Fortnite 50 ⚠ Играбельно
Grand Theft Auto V 42 ⚠ Играбельно
Counter-Strike 2 40 ⚠ Играбельно
Star Wars Battlefront 39 ⚠ Играбельно
Battlefield 5 35 ⚠ Играбельно
Forza Horizon 4 35 ⚠ Играбельно
Just Cause 3 32 ⚠ Играбельно
Batman: Arkham Knight 31 ⚠ Играбельно
Rise of the Tomb Raider 26 ✗ Низький
Far Cry 5 24 ✗ Низький
Forza Horizon 5 24 ✗ Низький
The Witcher 3 23 ✗ Низький
The Witcher 3: Wild Hunt 20 ✗ Низький
Cyberpunk 2077 16 ✗ Низький
Metro Exodus 16 ✗ Низький
Resident Evil 4 Remake 14 ✗ Низький
💡 24 games in the database for this GPU. ✓ playable (≥60 FPS), ⚠ medium (30-59), ✗ low (<30).

💻 Software compatibility

Counter-Strike 2 ✗ Weak
CPU
96%
GPU
29%
RAM
400%
Grand Theft Auto V ✓ Runs well
CPU
239%
GPU
398%
RAM
800%
Cyberpunk 2077 ✗ Weak
CPU
137%
GPU
66%
RAM
400%
Minecraft ✓ Runs well
CPU
478%
GPU
199%
RAM
800%
Fortnite ✗ Weak
CPU
87%
GPU
124%
RAM
400%
Valorant ✓ Runs well
CPU
319%
GPU
398%
RAM
800%
The Witcher 3: Wild Hunt ✗ Weak
CPU
159%
GPU
80%
RAM
533%
Elden Ring ✗ Weak
CPU
87%
GPU
41%
RAM
267%
Red Dead Redemption 2 ✗ Weak
CPU
159%
GPU
71%
RAM
400%
Apex Legends ✗ Weak
CPU
87%
GPU
50%
RAM
533%
Hogwarts Legacy ✗ Weak
CPU
106%
GPU
66%
RAM
200%
Dota 2 ✓ Runs well
CPU
319%
GPU
398%
RAM
800%
Baldur's Gate 3 ✗ Weak
CPU
87%
GPU
57%
RAM
400%
Starfield ✗ Weak
CPU
68%
GPU
29%
RAM
200%
Call of Duty: Warzone ✗ Weak
CPU
87%
GPU
57%
RAM
400%
League of Legends ✓ Runs well
CPU
478%
GPU
398%
RAM
999%
Sims 4 ✓ Runs well
CPU
319%
GPU
398%
RAM
800%
Helldivers 2 ✗ Weak
CPU
68%
GPU
31%
RAM
400%
Battlefield 5 ✗ Weak
CPU
106%
GPU
66%
RAM
400%
Far Cry 5 ✗ Weak
CPU
120%
GPU
90%
RAM
400%
Forza Horizon 4 ✓ Runs well
CPU
137%
GPU
111%
RAM
400%
Forza Horizon 5 ✗ Weak
CPU
106%
GPU
57%
RAM
400%
Metro Exodus ✗ Weak
CPU
120%
GPU
64%
RAM
400%
Overwatch ✓ Runs well
CPU
191%
GPU
398%
RAM
800%
PUBG: Battlegrounds ✗ Weak
CPU
120%
GPU
83%
RAM
400%
Resident Evil 4 Remake ✗ Weak
CPU
96%
GPU
49%
RAM
400%
Escape from Tarkov ✗ Weak
CPU
159%
GPU
80%
RAM
400%
God of War ✗ Weak
CPU
217%
GPU
83%
RAM
400%
Horizon Zero Dawn ✗ Weak
CPU
217%
GPU
66%
RAM
400%
Death Stranding ✗ Weak
CPU
191%
GPU
64%
RAM
400%
Control ✗ Weak
CPU
159%
GPU
66%
RAM
400%
Doom Eternal ✗ Weak
CPU
217%
GPU
99%
RAM
400%
Batman: Arkham Knight ✗ Weak
CPU
266%
GPU
99%
RAM
533%
Hitman 3 ✗ Weak
CPU
217%
GPU
99%
RAM
400%
Flight Simulator 2020 ✗ Weak
CPU
171%
GPU
80%
RAM
400%
Watch Dogs Legion ✗ Weak
CPU
171%
GPU
83%
RAM
400%
Borderlands 3 ✗ Weak
CPU
191%
GPU
71%
RAM
533%
Anno 1800 ✗ Weak
CPU
159%
GPU
99%
RAM
400%
Rainbow Six Siege ✓ Runs well
CPU
398%
GPU
199%
RAM
533%
The Division 2 ✗ Weak
CPU
217%
GPU
80%
RAM
400%
Gears Tactics ✓ Runs well
CPU
191%
GPU
133%
RAM
400%
Hunt Showdown ✗ Weak
CPU
171%
GPU
99%
RAM
533%
Tiny Tina's Wonderlands ✗ Weak
CPU
159%
GPU
49%
RAM
400%
Mafia Definitive Edition ✗ Weak
CPU
217%
GPU
99%
RAM
533%
Days Gone ✗ Weak
CPU
217%
GPU
66%
RAM
400%
Ghostwire Tokyo ✗ Weak
CPU
114%
GPU
83%
RAM
267%
Returnal ✗ Weak
CPU
137%
GPU
50%
RAM
200%
Dying Light 2 ✗ Weak
CPU
159%
GPU
49%
RAM
400%
Resident Evil Village ✗ Weak
CPU
137%
GPU
57%
RAM
400%
The Callisto Protocol ✗ Weak
CPU
96%
GPU
50%
RAM
400%
Atomic Heart ✗ Weak
CPU
149%
GPU
83%
RAM
400%
Alan Wake 2 ✗ Weak
CPU
114%
GPU
31%
RAM
200%
Black Myth Wukong ✗ Weak
CPU
96%
GPU
83%
RAM
200%
Ghost of Tsushima ✗ Weak
CPU
96%
GPU
83%
RAM
400%
The Last of Us Part 1 ✗ Weak
CPU
96%
GPU
50%
RAM
200%
Diablo 4 ✗ Weak
CPU
217%
GPU
99%
RAM
400%
Spider-Man Miles Morales ✗ Weak
CPU
159%
GPU
99%
RAM
400%
Star Wars Jedi Survivor ✗ Weak
CPU
96%
GPU
36%
RAM
400%
Dead Space Remake ✗ Weak
CPU
149%
GPU
49%
RAM
400%
Lies of P ✗ Weak
CPU
137%
GPU
83%
RAM
400%
Sons of the Forest ✗ Weak
CPU
96%
GPU
43%
RAM
267%
Rise of the Tomb Raider ✓ Runs well
CPU
319%
GPU
199%
RAM
800%
Shadow of the Tomb Raider ✗ Weak
CPU
266%
GPU
99%
RAM
400%
Assassin's Creed Odyssey ✗ Weak
CPU
239%
GPU
99%
RAM
400%
Assassin's Creed Valhalla ✗ Weak
CPU
137%
GPU
83%
RAM
400%
F1 24 ✗ Weak
CPU
266%
GPU
49%
RAM
400%
Need for Speed Heat ✗ Weak
CPU
137%
GPU
57%
RAM
400%
Civilization 6 ✓ Runs well
CPU
319%
GPU
199%
RAM
800%
Star Wars Jedi Fallen Order ✓ Runs well
CPU
266%
GPU
166%
RAM
400%

Configuration options

Available model options · 12 variants across 6 categories

⚙ Processors (3)
Intel Xeon E3-1535MV5 Intel Core i7 (6th Gen) 6820HQ Intel Core i5 6300HQ
🖥 Displays (1)
1920 x 1080 (Full HD)
🎮 Graphics (4)
Quadro M2000M Quadro M1000M AMD FirePro W5170M Quadro M1000M 2GB
• Igpu (1)
Intel HD Graphics 520
🔲 Memory (1)
16 GB (2 x 8 GB)
💾 Storage (2)
256 GB SSD M.2 PCIe 1 TB HDD SATA 6Gb/s

Similar models

Explore alternatives across different angles.