Model review

Lenovo ThinkPad L430 review

Lenovo ThinkPad L430 — from 2012, 2.3 kg, performance 28.
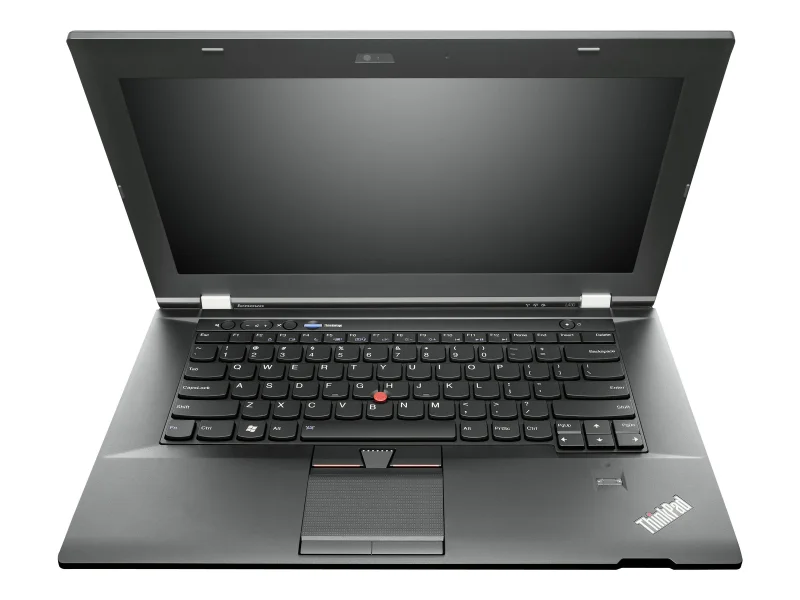
Lenovo ThinkPad L430

Technical specifications

Type Business
Release year 2012
Screen 14" · 1600x900
Processor Intel Core i5 3210M , Intel Core i5 2520M , Intel Core i3 3110M , Intel Core i5 3230M
Graphics NVS 5400M
Max. RAM 16 GB
Weight 2.3 kg
Battery 57 Wh

Performance scores

Performance
28
/100
CPU
15
/100
GPU
46
/100
USComp
43
/100

A graphics placing the game gates flatly contradict

The ThinkPad L430 from 2012 asks $106, deep under the business-class median of $297. On paper its headline reads impressively: a best GPU score of 45.85, 1094% above the class median, thanks to an NVS 5400M discrete card. The truth needs the full data set: the NVS 5400M was an entry business card even in 2012, the CPU reads 14.67 against a 52.97 median, and the game gates — the final word — fail across the board: GTA V fails minimum, and Far Cry 5 and Battlefield 5 fall far below theirs. No gaming claim survives the data.

Retiring the claim honestly

On paper, this machine reads as built for GPU-accelerated workloads and gaming; the ok-flags retire that label completely. The NVS 5400M was built for multi-monitor business desktops, not frames — thirteen years later it cannot clear a single modern minimum bar. The placing of 45.85 is a percentile artifact of a business class that is mostly integrated-only; the flags, not the placing, are the truth.

What remains at $106

An honest reading of this listing: a classic-era ThinkPad chassis (the L-series shared the T-era keyboard and serviceability), a third-generation Core i5, and 16GB of RAM — bought for typing, light browsing, and nostalgia, with a reliability index of 13 and a CPU at 72% below the class median setting the speed floor. The GPU badge is a period detail, not a capability.

Price trajectory

From a $1,300 anchor the machine has settled at $106 at 5.95% per year, with a two-year projection of $93. The value unwound long ago; the remaining price is utility money on survivorship odds.

Against the alternatives

The band is fellow 2012-2013 business metal: HP's EliteBook 8470p at $120 and Lenovo's own ThinkPad T430 at $117 above; Dell's Latitude E4310 at $100 and HP's EliteBook 8440p at $100 below. The T430 — same era, the enthusiast favorite — is $11 more and the better-remembered machine; cross-shop it first.

Bottom line

A budget-friendly pick as a typing machine and a piece of ThinkPad history — and nothing else. The honest verdict: the graphics placing is flattery the flags contradict, the CPU is the real ceiling, and the gaming label deserves to be ignored. At $106 the price says utility; so should the buyer.

🧭 Your context

Stage: Refining requirements

You're refining — compare finalists head-to-head.

🎯 For your profile

You've viewed: You've recently viewed 38 models — compare this model with them in the analogs matrix.

⭐ What stands out

graphics performance
45.9
CPU performance
14.7
reliability
13
above median below median class median
  • graphics performance is higher than typical business class (+200%) (mainstream tier).
    top 25% of its category
  • CPU performance is lower than typical business class (+72.3%) (basic tier).
    budget segment of category
  • reliability is lower than typical business class (+69.4%) (low tier).
    budget segment of category

🔁 Alternatives

Compromise axis: reliability ↔ price

↑ Pricier and more powerful
↓ Cheaper and less powerful

🎮 What it can run

⚙️ Configuration analysis

Top configuration: Intel Core i5 3210M · NVS 5400M · 16GB RAM
CPU: Intel Core i5 3210M · 3rd GPU: NVS 5400M RAM: 16 GB
mainstream tier

Top configuration suits everyday productivity, light photo editing, and esports titles.

🤔 How to choose

Universal advice for any use case.

  • Reliability vs price: reliability (median 42.5) ↔ price (median 297.4).
  • Weight vs CPU: mobility (median 60) ↔ overall performance (median 41.5).
  • Upgradeability vs battery: upgradability (median 62.5) ↔ battery life (median 3.3).

ThinkPad L430: verdict

+
Best for: GPU-accelerated workloads and gaming
!
Watch out for: CPU-intensive compute work
$
Price: $106 — worth the asking price

➡️ Next step

You're refining — compare finalists head-to-head.

Technical reference for Lenovo ThinkPad L430.

Full specifications

Brand
Lenovo
Series
ThinkPad L13/L14/L15/L16
Type
Business
Release year
2012
Screen size
14"
Resolution
1600x900
Panel type
tn
Color gamut (sRGB)
100%~
Graphics
NVS 5400M
RAM (max)
16 GB DDR3
Weight
2.30 kg
Ports
7
TPM (security)
Optical drive
Battery
57 Wh

Performance scores

Performance
28
/100
CPU
15
/100
GPU
46
/100
USComp
32
/100

Performance metrics

Performance 28
Portability 44
Light office 33
Gaming 71
Creative 43
Energy efficiency 42
Connectivity 93
Value 52
Color accuracy

🎮 Gaming performance

FPS @ 1080p for the model's best GPU

Game FPS (1080p) Verdict
CS:GO 240 ✓ Комфортно
Overwatch 240 ✓ Комфортно
GTA V 140 ✓ Комфортно
PUBG: Battlegrounds 140 ✓ Комфортно
Valorant 35 ⚠ Играбельно
Dota 2 18 ✗ Низький
Forza Horizon 4 8 ✗ Низький
The Witcher 3 7 ✗ Низький
Fortnite 5 ✗ Низький
Cyberpunk 2077 3 ✗ Низький
Far Cry 5 3 ✗ Низький
Battlefield 5 2 ✗ Низький
Forza Horizon 5 2 ✗ Низький
Metro Exodus 2 ✗ Низький
Counter-Strike 2 1 ✗ Низький
💡 15 games in the database for this GPU. ✓ playable (≥60 FPS), ⚠ medium (30-59), ✗ low (<30).

💻 Software compatibility

Counter-Strike 2 ✗ Weak
CPU
29%
GPU
66%
RAM
200%
Grand Theft Auto V ✗ Weak
CPU
73%
GPU
917%
RAM
400%
Cyberpunk 2077 ✗ Weak
CPU
42%
GPU
153%
RAM
200%
Minecraft ✓ Runs well
CPU
147%
GPU
459%
RAM
400%
Fortnite ✗ Weak
CPU
27%
GPU
287%
RAM
200%
Valorant ✗ Weak
CPU
98%
GPU
917%
RAM
400%
The Witcher 3: Wild Hunt ✗ Weak
CPU
49%
GPU
183%
RAM
267%
Elden Ring ✗ Weak
CPU
27%
GPU
96%
RAM
133%
Red Dead Redemption 2 ✗ Weak
CPU
49%
GPU
164%
RAM
200%
Apex Legends ✗ Weak
CPU
27%
GPU
115%
RAM
267%
Hogwarts Legacy ✗ Weak
CPU
33%
GPU
153%
RAM
100%
Dota 2 ✗ Weak
CPU
98%
GPU
917%
RAM
400%
Baldur's Gate 3 ✗ Weak
CPU
27%
GPU
131%
RAM
200%
Starfield ✗ Weak
CPU
21%
GPU
66%
RAM
100%
Call of Duty: Warzone ✗ Weak
CPU
27%
GPU
131%
RAM
200%
League of Legends ✓ Runs well
CPU
147%
GPU
917%
RAM
800%
Sims 4 ✗ Weak
CPU
98%
GPU
917%
RAM
400%
Helldivers 2 ✗ Weak
CPU
21%
GPU
71%
RAM
200%
Battlefield 5 ✗ Weak
CPU
33%
GPU
153%
RAM
200%
Far Cry 5 ✗ Weak
CPU
37%
GPU
208%
RAM
200%
Forza Horizon 4 ✗ Weak
CPU
42%
GPU
255%
RAM
200%
Forza Horizon 5 ✗ Weak
CPU
33%
GPU
131%
RAM
200%
Metro Exodus ✗ Weak
CPU
37%
GPU
148%
RAM
200%
Overwatch ✗ Weak
CPU
59%
GPU
917%
RAM
400%
PUBG: Battlegrounds ✗ Weak
CPU
37%
GPU
191%
RAM
200%
Resident Evil 4 Remake ✗ Weak
CPU
29%
GPU
112%
RAM
200%
Escape from Tarkov ✗ Weak
CPU
49%
GPU
183%
RAM
200%
God of War ✗ Weak
CPU
67%
GPU
191%
RAM
200%
Horizon Zero Dawn ✗ Weak
CPU
67%
GPU
153%
RAM
200%
Death Stranding ✗ Weak
CPU
59%
GPU
148%
RAM
200%
Control ✗ Weak
CPU
49%
GPU
153%
RAM
200%
Doom Eternal ✗ Weak
CPU
67%
GPU
229%
RAM
200%
Batman: Arkham Knight ✗ Weak
CPU
82%
GPU
229%
RAM
267%
Hitman 3 ✗ Weak
CPU
67%
GPU
229%
RAM
200%
Flight Simulator 2020 ✗ Weak
CPU
52%
GPU
183%
RAM
200%
Watch Dogs Legion ✗ Weak
CPU
52%
GPU
191%
RAM
200%
Borderlands 3 ✗ Weak
CPU
59%
GPU
164%
RAM
267%
Anno 1800 ✗ Weak
CPU
49%
GPU
229%
RAM
200%
Rainbow Six Siege ✓ Runs well
CPU
122%
GPU
459%
RAM
267%
The Division 2 ✗ Weak
CPU
67%
GPU
183%
RAM
200%
Gears Tactics ✗ Weak
CPU
59%
GPU
306%
RAM
200%
Hunt Showdown ✗ Weak
CPU
52%
GPU
229%
RAM
267%
Tiny Tina's Wonderlands ✗ Weak
CPU
49%
GPU
112%
RAM
200%
Mafia Definitive Edition ✗ Weak
CPU
67%
GPU
229%
RAM
267%
Days Gone ✗ Weak
CPU
67%
GPU
153%
RAM
200%
Ghostwire Tokyo ✗ Weak
CPU
35%
GPU
191%
RAM
133%
Returnal ✗ Weak
CPU
42%
GPU
115%
RAM
100%
Dying Light 2 ✗ Weak
CPU
49%
GPU
112%
RAM
200%
Resident Evil Village ✗ Weak
CPU
42%
GPU
131%
RAM
200%
The Callisto Protocol ✗ Weak
CPU
29%
GPU
115%
RAM
200%
Atomic Heart ✗ Weak
CPU
46%
GPU
191%
RAM
200%
Alan Wake 2 ✗ Weak
CPU
35%
GPU
71%
RAM
100%
Black Myth Wukong ✗ Weak
CPU
29%
GPU
191%
RAM
100%
Ghost of Tsushima ✗ Weak
CPU
29%
GPU
191%
RAM
200%
The Last of Us Part 1 ✗ Weak
CPU
29%
GPU
115%
RAM
100%
Diablo 4 ✗ Weak
CPU
67%
GPU
229%
RAM
200%
Spider-Man Miles Morales ✗ Weak
CPU
49%
GPU
229%
RAM
200%
Star Wars Jedi Survivor ✗ Weak
CPU
29%
GPU
83%
RAM
200%
Dead Space Remake ✗ Weak
CPU
46%
GPU
112%
RAM
200%
Lies of P ✗ Weak
CPU
42%
GPU
191%
RAM
200%
Sons of the Forest ✗ Weak
CPU
29%
GPU
100%
RAM
133%
Rise of the Tomb Raider ✗ Weak
CPU
98%
GPU
459%
RAM
400%
Shadow of the Tomb Raider ✗ Weak
CPU
82%
GPU
229%
RAM
200%
Assassin's Creed Odyssey ✗ Weak
CPU
73%
GPU
229%
RAM
200%
Assassin's Creed Valhalla ✗ Weak
CPU
42%
GPU
191%
RAM
200%
F1 24 ✗ Weak
CPU
82%
GPU
112%
RAM
200%
Need for Speed Heat ✗ Weak
CPU
42%
GPU
131%
RAM
200%
Civilization 6 ✗ Weak
CPU
98%
GPU
459%
RAM
400%
Star Wars Jedi Fallen Order ✗ Weak
CPU
82%
GPU
382%
RAM
200%

Configuration options

Available model options · 14 variants across 6 categories

⚙ Processors (4)
Intel Core i5 (3rd Gen) 3210M Intel Core i5 (2nd Gen) 2520M Intel Core i3 (3rd Gen) 3110M Intel Core i5 (3rd Gen) 3230M
🖥 Displays (2)
1366 x 768 (HD) 1600 x 900 (HD+)
🎮 Graphics (3)
Intel HD Graphics 4000 Intel HD Graphics 3000 NVS 5400M
• Igpu (1)
Intel HD Graphics 4000
🔲 Memory (2)
4 GB (1 x 4 GB) 8 GB (2 x 4 GB)
💾 Storage (2)
320 GB HDD SATA 3Gb/s 500 GB HDD SATA 3Gb/s

Similar models

Explore alternatives across different angles.